Debugging is a necessary evil when developing any piece of software and games are no exception. The good news is that dot big bang is a great environment for debugging, with a combination of fast iteration times and built-in tools that takes a lot of the stress out of diagnosing and fixing issues.
Defensive Development Strategies
The best kind of debugging is the debugging you avoid by preempting problems via smart development. Building games defensively is really two key ideas.
Build From Simple To Complex
This is neatly summed up by Gall's Law which states that all complex systems that work evolved from simpler systems that worked. If you want to build a complex system that works, build a simpler system first, and then improve it over time.
From the perspective of debugging it’s much easier to test and verify that something simple works than it is to build something complex and try to do the same. Simpler things are also much easier to reason about, and therefore much easier to debug. Building simply first also gives you foundational insight into the gameplay you’re making, allowing you to adapt the more complex elements of your design, and preempt potential problems as a result.
Build Small Pieces
As an extension of building from simple to complex you should also build out any feature in small chunks that you can test before adding the next. By verifying each element as you go, and testing how they work in combination, you massively increase the ease of isolating and diagnosing bugs. This modular structure will also help debugging in the future, as you will be able to more easily pull the system or feature apart.
Debugging Tools
console.log
Browsers all have an inbuilt ability to log text messages out to a scrolling display. Shown here is the console window in Chrome Dev Tools.
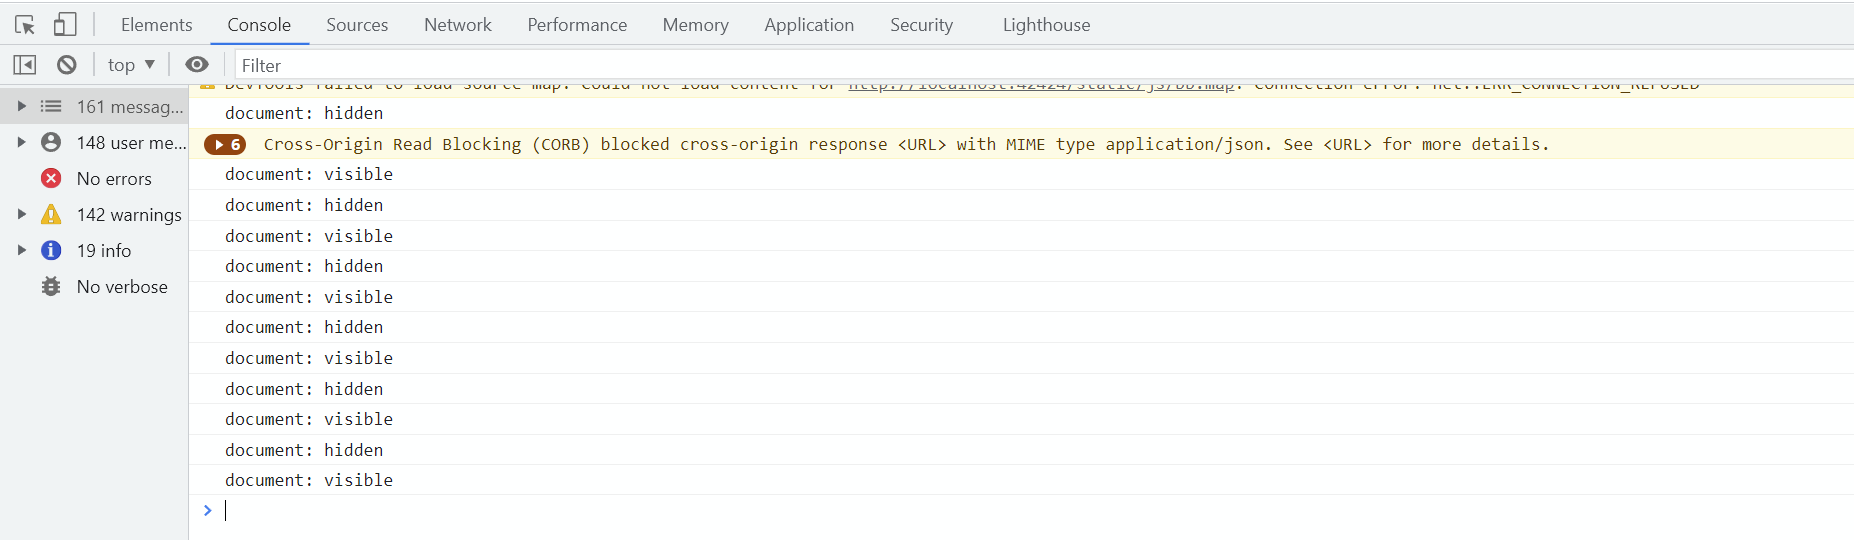
You can pull this up with ctrl-shift-i on Windows or cmd-option-i on Mac and selecting the Console tab. It can also be accessed by the hamburger menu (the …) in the top-right of the browser window via the More tools>Developer tools path.
Console logging provides a no frills way of getting information from your game as it’s running. You can set up and pass out a lot of information and then review it as it scrolls by, or test specific issues and see the values that come out. It also provides a lot of formatting options. Here are some examples:
// logs an expandable object
console.log({
  log: "this data",
  containing: "more data",
  and: this.someNumber,
});

// styling with inline css
console.log("%cTHIS IS BIG", "font-size:50px");

// multiple styles
console.log(
  "%cthis is small and red %cthis is big and blue",
  "color:red",
  "color:blue; font-size:50px",
);
With the following output:
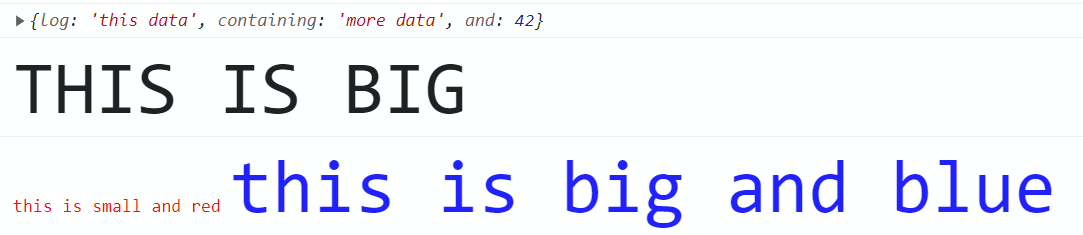
There are a much wider array of formatting options and you should check out this document on MDN for more detailed information.
Console logging is best used for quick checks, seeing how values change over time, and importantly debugging problems that occur across the network. In the latter case, having good logging lets you follow the flow of execution as it crosses the network and is received on the other side.
Debugger
Most browsers ship with a comprehensive set of developer tools including a traditional debugger that lets you step through your source code and inspect what’s happening as it executes. The debugger is most useful when you want to drill into exactly what’s happening when a piece of code is being run, and offers powerful tools to inspect the state of the entire running program at that point in time. It’s a fantastic tool to understand and diagnose problems once you’ve isolated where they are happening, or to verify that newly written code is doing the right thing.
You can pull the debugger up in Chrome Dev Tools with ctrl-shift-i on Windows or cmd-option-i on Mac and selecting the Source tab.
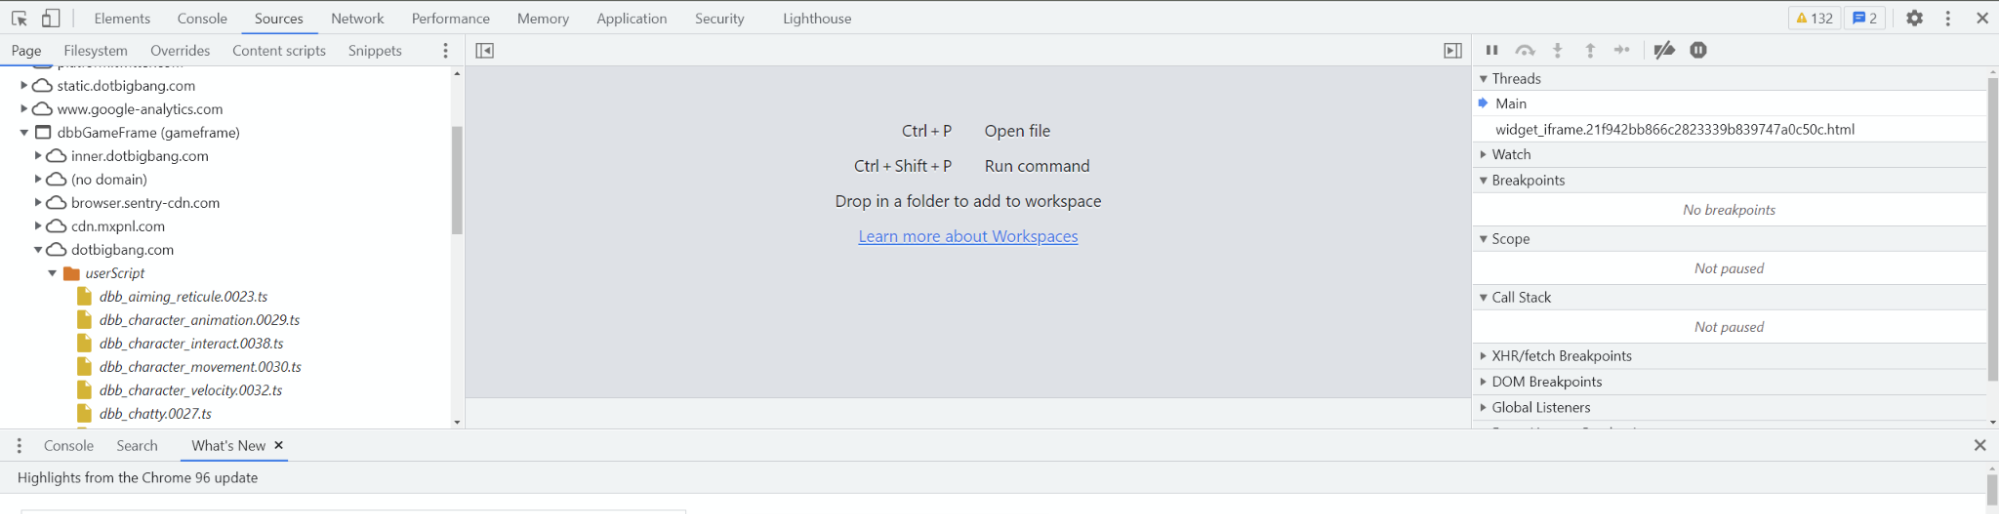
Opening A Script
You can find the scripts in the dbbGameFrame/dotbigbang.com/userScripts folder. This is shown in the image above. Double clicking a script will open it in the main pane.
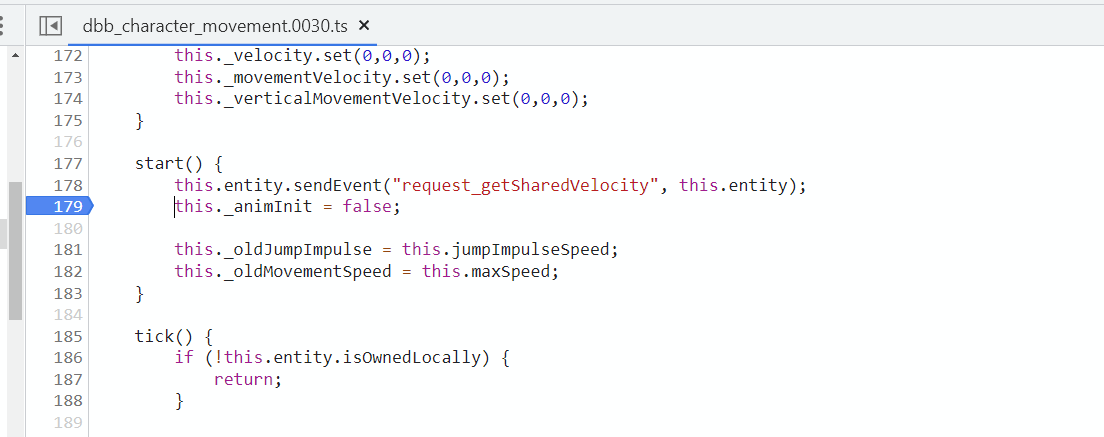
Breakpoints
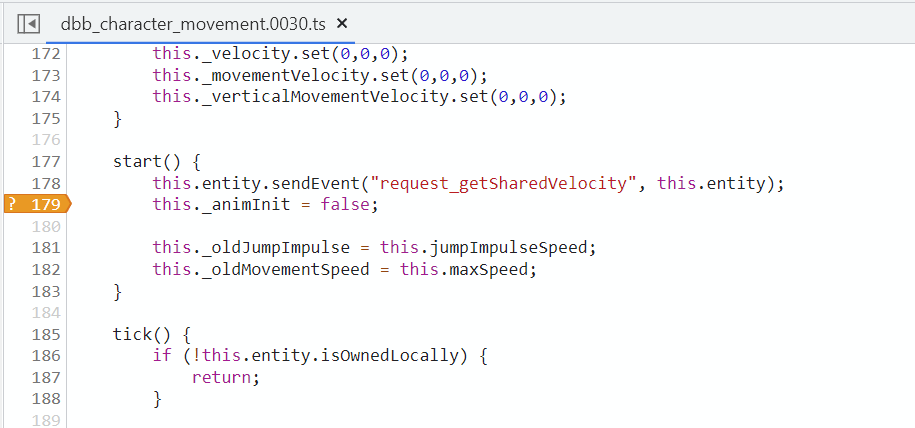
Breakpoints allow you to specify where execution of a script will pause and the debugger will start. You can add a breakpoint by clicking on the line number in the left margin. Some lines cannot be stopped on and the tool will find the nearest line to that which can be used. Below you can see a breakpoint set on line 179.
Conditional Breakpoints
Breakpoints can also be set to only trigger when a user defined expression evaluates to true. You can set this by right clicking on a set breakpoint and selecting Edit breakpoint… this will then allow you to type an expression to be evaluated. This is very useful when a breakpoint would otherwise be hit routinely, and you want to only trigger it when some conditions have been met. An important thing to keep in mind is that you can add code to your script to help make writing the expression easier if you need to. Below you can see a conditional breakpoint set on line 179.
Stepping Through Code
Once the breakpoint has been hit, the code execution will pause at that point and allow the programmer to investigate the current program state. You can continue execution or step through the code one line at a time. The current line is highlighted in the main source view. You can also see more information about the current program state in the panel to the right, shown below.
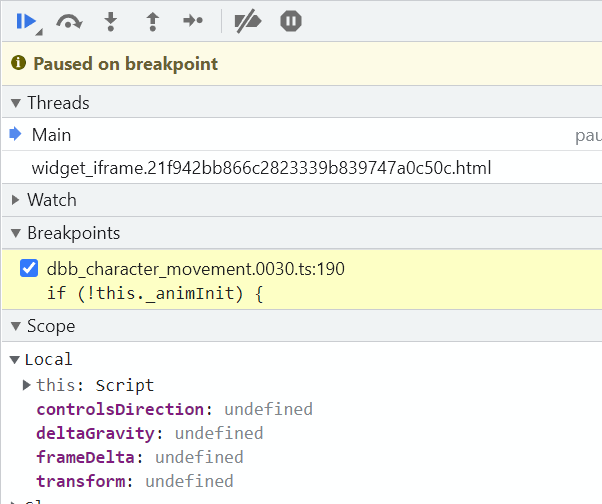
The controls at the top allow you to resume code execution and step through the code in various ways. These control how stepping interacts with function calls, such as whether or not the step will go into the function,or if the next step should jump out of the current function. There are handy keyboard shortcuts for these, and it’s worth learning them to move through your code quickly.
Watch
The watch window lets you write your own expressions that will be evaluated at each step. These can be as simple as simply viewing the value of a property or a complex series of function calls. Some examples are shown below.
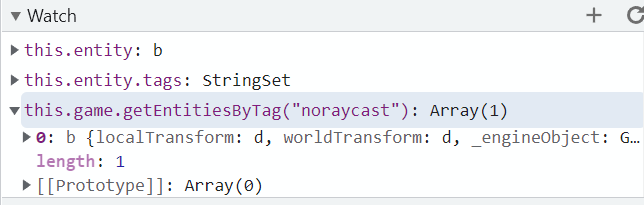
This is supremely useful to inspect the state of the program and how it changes as you step through. It offers the capability to browse into the full state of the running program at each step by writing expressions and delving into their results. As you can see above, you can expand and collapse values like Objects and Arrays and view their contents.
Judicious use of watch expressions and stepping through code are amazing tools to gain insights about what your code is doing and the state of the program data.
Ignoring Minified Code
dot big bang ships with all its source code minified. That means it has been packed down and mangled to be as small as possible. As such it’s really hard to read.
Game code often goes into engine code as it’s executing and you quite often want to see where it comes out the other side. Sometimes this is as easy as stepping over a function call rather than into it. But sometimes you want to see if a call enters other gameplay code. This is particularly true with calls like sendEvent that go into the engine with the express intent to call methods on other scripts. In those cases stepping through the engine code is hard to understand and a waste of time.
Chrome Dev Tools very usefully allows you to ignore files for the purposes of debugging. This means the debugger will automatically skip over them and pause again when it leaves them and enters a different file.
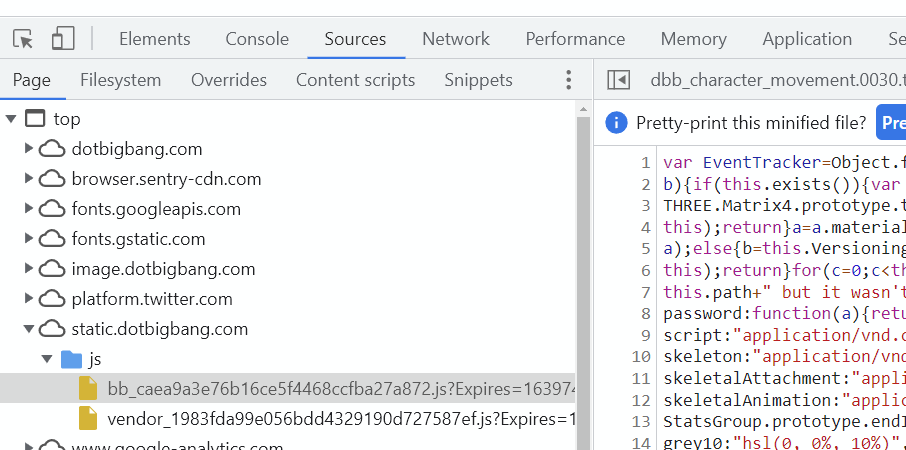
Highlighted above is the file you want to ignore, the _bb__ JavaScript file, if you navigate in the Source view to _top/static.dotbigbang.com/js_ you can find it. Double click it to open it and then right click in the main view and select the Add script to ignore list option.
If you want to make this a permanent change you can add the file to the ignore list in the Dev Tools options menu. Below is a handy regex pattern to add.
bb_[\w]+\.js
Debugging Strategies
These are some straightforward tips to help you diagnose and find the root cause of issues you experience. They’re not just applicable to debugging, so keep them in mind whilst you’re making things!
Form a Hypothesis
Debugging is a lot like running a scientific experiment with your own code. It pays to start off having a bit of a think about why the issue is occurring at all. This should guide your investigation, and should be revisited after each attempt to figure out what is happening. Likewise, each test you run through should be an attempt to prove or disprove the hypothesis you currently have.
Find a Solid Reproduction
The easiest problem to find and fix is one that happens every single time. If you run into an issue that doesn’t happen every time it’s well worth the effort to find out how to trigger it reliably.
Likewise if a case requires a lot of steps to reproduce it’s worth the time isolating the problem by setting up a test case so you can skip to the step that causes the issue. This might involve building a new smaller version of your game, a minimal reproduction, that just contains the elements involved setup in a way that causes the issue to happen.
Turning a problem that occurs one time in ten into a problem that happens every time is a great way to make it easy to form a hypothesis about.
Divide and Conquer
An awesome way to explore the problem space is to start turning off pieces of the code involved. For example, creating a game that only includes the elements needed to reproduce the bug is a great way to isolate things to begin with. From there you can follow your current hypothesis and disable parts of the code that you think don’t have anything to do with the current bug and see if it is still reproducible. This allows you to narrow in on the sections of code that are causing the problem.
Use Context
If you’re building something when a bug shows up, and you’ve been following the advice at the top of this article, you’ll know that only a small portion of code has actually changed. Even if the bug has manifested somewhere totally different, it’s highly likely that the thing you just touched is the root cause somehow. So you’d be wise to investigate there first, for example by removing it and seeing if the problem persists.
Rubber Duck Debugging
Sometimes all it takes to unlock a problem is to tell someone else about it. Explaining a problem out loud in a way someone else can understand engages different parts of your brain and can lead you to missed connections. The amazing thing is that this doesn’t even have to be another person you can talk to inanimate objects! Or try to make a video explaining your problem.
Sleep On It
Getting enough sleep is crucial to doing work that uses your brain. So one part of debugging is to leave a problem whilst you are tired. You’ll feel better if you avoid hammering away on a problem and likely solve it quickly when you’re feeling fresh.
Taking a break also gives your brain time to subconsciously process things. Sometimes the answer or at least a breakthrough will just pop into your head whilst you’re washing the dishes or taking a shower.
Wrap Up
Debugging can be a frustrating experience but hopefully the tools and tips we’ve gone through with this article leave you better prepared to tackle it. You’re not alone though, and if you’re stuck on a particular problem, please reach out to us and the rest of the community in Discord. Getting into a live debugging session with someone who can show you the ropes is a great way to learn how to do it better yourself.
We also live stream development on Twitch and cause ourselves problems and headaches all the time. Joining these sessions is another good way to pick up tips and see these suggestions used by experienced developers.